Save dozens of minutes daily during writing Selenide and Selenium E2E automated tests using the Selenideium Element Inspector Chrome Extension!

Would it be awesome in case you could save dozens of minutes daily while you are developing E2E tests using Selenium or Selenide? Well, I could do that, and you can do it too.
I have developed a Chrome plugin with which you can automagically generate the Selenide and Selenium selectors by simply clicking on a web element. Just
- Install the plugin
- Open a page
- Open DevTools
- Open the console
- Enable permanent log in the console's settings to prevent clearing the console on page change
- Click on an element
- Select the most nice-looking selector
- Copy-paste it into your favourite IDE
- Go to 6.
That's it.
You can download the plugin from the Chrome Web Store: Selenideium Element Inspector
In case you are interested in how I developed the plugin, just continue reading.
The Inspiration
A few days ago I was sweeping through Hashnode's recent articles when I stumbled across an interesting one: How To Make A Google Chrome Extension In Under 15 – Minutes? from Rajiv Verma. Reading Rajiv's article you can realize how easy it is to write a Google Chrome Extension. It immediately inspired me to think about what kind of Google Chrome extension would be useful for me.
The Idea
I don't like to repeat the same thing again and again manually. Being a software developer and a test automation engineer it is quite straightforward, to automate tedious tasks.
Google Dev Tools is my favourite toolset when I am working on E2E automation. During automating I spend most of my time browsing the DOM elements, trying to find the best element selectors. I was sure I will write something which will help me with that.
A few hours later, the idea was born: Create a plugin that logs the attributes of an element to the console after clicking it. In addition to that, immediately print the belonging Selenide and Selenium selectors to that element. It would be awesome to have such a plugin.
I did not want to start developing it in the middle of the night, so I decided to sleep, but I was so excited it was quite hard to fall asleep.
The Goal
I got up an hour ago, read some messages, then went for my usual morning smoking session. I was thinking what should be the name of the extension and I came up with "Selenideium Element Inspector". Who knows, maybe there will be a better name, but it is more than enough to start with.
I came back from smoking, sit down in front of my computer, and started to type this article. So here I am.
The MVP
I defined what should be my Minimum Viable Product (MVP). The extension has to be able to log to the console the clicked element's attributes and also at least the CSS Selenide and Selenium selectors.
The Timeframe
However it is Sunday, I decided to write and finish the first version of the plugin today. My family is still sleeping so I have some time now, and as my son is going to school tomorrow he has to go to bed quite early, which gives me another few hours in the evening. During the day I would like to spend time with my son and wife, playing Minecraft and Fortnite and doing other stuff, but I think I can also use 1-2 hours from the day to continue development (and writing).
Let's start
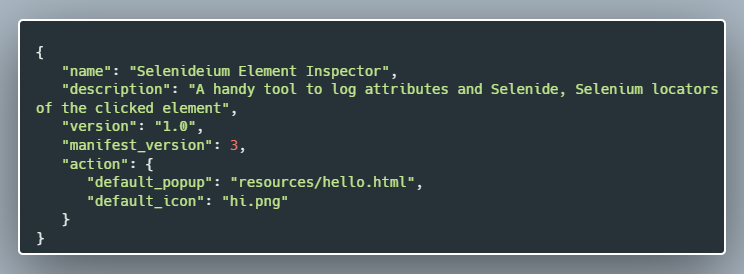
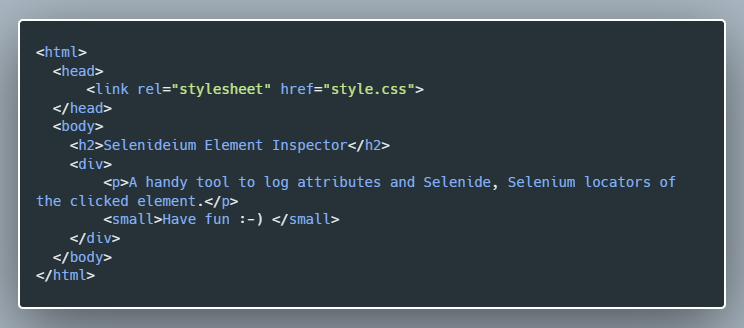
After creating and cloning a git repo, I've opened the project in my favourite IDE Intellij IDEA and followed the steps described in Rajiv's article, so I created the manifest.json and hello.html file and a style.css.
manifest.json
hello.html
style.css

And that is it. In 10 minutes we are ready with the first version of our plugin. I know its capabilities are a little bit limited at the moment, but it is still awesome.
Install the plugin
Open chrome://extensions/ and enable developer mode. As our extension is not on the google marketplace (yet) we have to install it manually.
Open "Load Unpacked", select the folder of the project and open it. Tatatataaaa. Your plugin is already added to Chrome.
Click on the "extensions" icon on the top right corner of your chrome, and pin your extension to the navbar. And now click the icon.
The hello.html is displayed.
Pure awesome.
Time to make our first commit and push. You can find the project on GitHub: https://github.com/mszeles/selenideium-element-inspector
Adding functionality
In order to add functionality to the plugin, I followed the steps described here.
Printing the clicked element to console
Add the following section to manifest.json:

And create the content.js file:

That's it. We have already achieved our first goal to print the clicked element to the console. Let's continue.
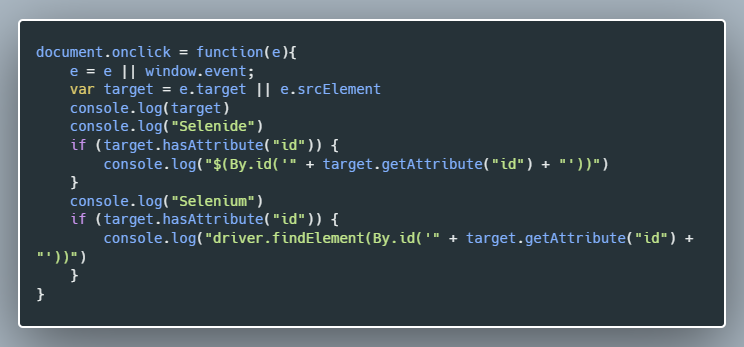
Printing id base selectors
The best way to find an element is using its id. So let's print the selectors in case the element has an id. After adding, the content.js looks like this:
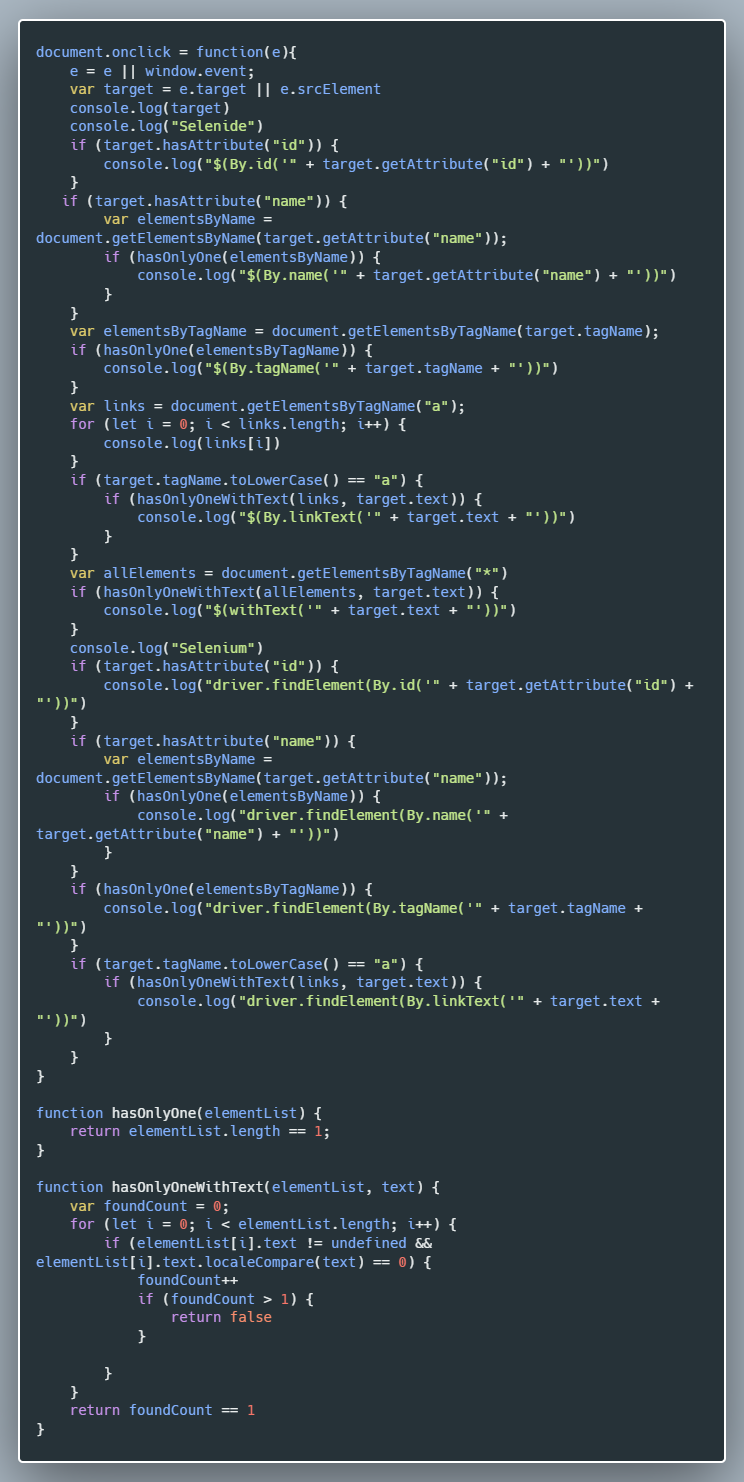
Printing name, linkText, tagName, withText selectors in case they are unique:
Printing CSS selector
For this one I found the solution on Stackoverflow. Here is the relevant part:
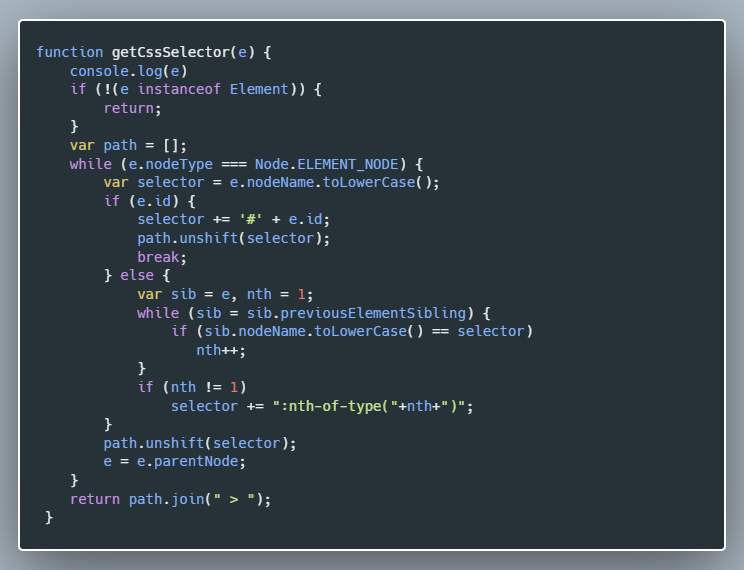
And that's it. We are ready with the plugin. I have uploaded to the Chrome Web Store.
What do you think about the plugin? Will you use it? Would you like to have a new feature? Share your feedback in the comment sections.
Share this article, so more people can save dozens of minutes daily.😊
In case you do not want to miss my posts, just follow me here on Hashnode, on LinkedIn, on Twitter on Medium.com, on dev.to and even on Instagram. 😊
📚Join the Selenide community on LinkedIn! ✌


